HDMI Capture and Analysis FPGA Project 4
Part 4 / 6: HDMICAP Driver and userland software
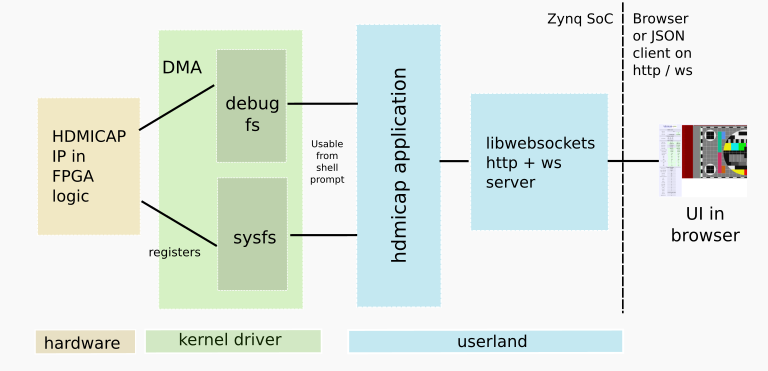
Capturing the stats and data in hardware is only half the problem, we need to make it available and easily consumed. We use Linux on the CA9s in the Zynq SOC with a kernel driver plus userland networking stack.
Software overview
The Xilinx tools generate a binary file which is loaded into the programmable logic at bootloader time.
The Linux kernel gets a driver added which allows the hardware to be queried and controlled using sysfs and a debugfs node which provides file semantics compatible with dd, for the bulk DMA data. So DMA captures may be dd'd out into userland, opened in gimp etc.
sysfs interface
The main sysfs node 'status' issues a JSON structure that contains all the information around captured statistics that are valid.
# cat /sys/devices/soc0/amba/43c10000.hdmicap/state
At the lowest level, the MCMM (PLL) used to regenerate the x5 clock must report it is locked, otherwise no other information is valid.
{
 "pll_locked":"0",
}
If it is locked, it checks to see if the sync level (whether HSYNC and VSYNC are active low or high) has been successfully autodetected by the driver yet.... without that, none of the measurements related to raster timing will be valid.
{
 "pll_locked":"1",
 "syncs_detected":"0",
 "sanity":"0",
 "pxclk_MHz":"74.255587",
 "ctrl_ch0_pc":"37067.5",
 "ctrl_ch1_pc":"9755.0",
 "ctrl_ch2_pc":"9755.4",
 "dvi":"0",
}
The ctrl_chx_pc members contain the number of control period symbols seen on that channel during the (short) sample period. If there are no data island periods, then these numbers should be about the same for all channels. If there are data island periods, ch0 should have many more control symbols. This is useful if you suspect problems with, eg, physical connectivity or readability of one of the data channels.
The "sanity" member is a summary of if the timing measurements pass some simple tests for making sense.
If the PLL lock is there and the driver found the HSYNC and VSYNC polarity, the whole JSON state is sent.
{
 "pll_locked":"1",
 "syncs_detected":"1",
 "sanity":"1",
 "pxclk_MHz":"74.255587",
 "ctrl_ch0_pc":"37067.5",
 "ctrl_ch1_pc":"9755.0",
 "ctrl_ch2_pc":"9755.4",
 "dvi":"0",
 "hpol":"+",
 "vpol":"+",
 "hact":"1280",
 "vact":"720",
 "hrate_kHz":"55.214",
 "vrate_Hz":"73.619",
 "htot":"1980",
 "hbl":"700",
 "hsa":"40",
 "hfp":"440",
 "hbp":"220",
 "vtot":"750",
 "vbl":"30",
 "vsa":"5",
 "vfp":"5",
 "vbp":"20",
 "px_in_frame":"1485000",
 "htot_in_frame":"750.000",
 "integer_htot_in_frame":"1",
 "line_timestamp":"457",
 "frame_timestamp":"17577",
 "data_px_active":"416045",
 "data_px_active_line":"577.840",
 "data_vb":"23281",
 "ctrl_px_active":"85640",
 "ctrl_px_active_line":"118.944",
 "ctrl_vb":"33977",
 "est_video_clocks":"924617",
 "actual_video_clocks":"921600",
 "terc4_errs_frame":"766",
 "vsync_onset_hpx":"0"
}
There are also nodes that control various things and can trigger data capture.
debugfs interface
The driver also presents a debugfs node that provides the file semantics needed by, eg, dd
/sys/kernel/debug/framestore
To grab one complete frame, raw but with active video converted to RGBA
 # echo 0 > /sys/devices/soc0/amba/43c10000.hdmicap/frames
 # echo 1 > /sys/devices/soc0/amba/43c10000.hdmicap/grab
 # dd if=/sys/kernel/debug/framestore of=dump.rgba
 11601+1 records in
 11601+1 records out
 5940004 bytes (5.9 MB) copied, 0.184539 s, 32.2 MB/s
The end of the "file" in debugfs is decided by the end of the DMA action, for capture of frames that's at the end of the last frame. In this case it's one 720p frame (htot x vtot, ie, active video and blanking together).
Automatic statistics and image polling
The kernel driver's commandline interface is actually quite usable, but for casual users, like production test or for continuous debugging, it's not the friendliest UI.
So there is also a userland application, 'hdmicap', which reads the sysfs nodes and automatically cycles between reading the statistics counters, taking video frame samples, and capturing frame data island content and stats.
Summarizing Data Islands
When analyzing the data island content, hdmicap summarizes counts by type, and extracts selected information from the data packets.
One piece of information that's particularly interesting is in the AVI infoframe (type 0x82), this is a "VIC" byte that can be sent by the source to summarize which standardized mode the source is sending. There's a seprate standard CEA-861 which defines timing on a whole bunch of common modes, usually known as "CEA modes".
If we see the VIC byte coming, it implies what the rest of the timing and clock "should" be. So we can compare the CEA info against what we actually measure to assess the correctness of what was actually sent against what it claims it was sending.
Adding HTTP and WS in userland
The 'hdmicap' userland application also uses HTML and Javascript to make a browser-compatible server than can be used over the network.
In addition when serving to the network, hdmicap expands the JSON from the kernel by adding other information to it, such as counts of data island types and if the CEA VIC appeared, information on the CEA mode timing.
Rendering captured HDMI data
Although we can capture one or more frames to DDR in raw or "active video as RGBA" modes, these are difficult to use in a UI. The full raster 720p capture for one frame is 6MB. So hdmicap spawns imagemagick's convert tool for each captured frame to convert to png. This is then made available at http://ip/dump.png.
Unfortunately on cortex A9s, this operation is slow, and how slow depends on the complexity of the image data. So captures lag realtime by 2-5s. However since they complete in a forked process, the rest of the ui is not affected and updates many times a second continuously. The browser updates automatically each time a new png is ready.
Continued
The the next part shows how to reproduce your own hdmicap analyzer.