 Intrigued by the magic correlator possibilities, I wrote some code to simulate a proper worst-case Monte Carlo analysis of the performance vs noise, with fascinating results. (Although I tried to choose reasonably large number of random runs considering the CPU time needed, please bear in mind the numbers identified in the rest of this are only as accurate as the number of runs allows.)
False indication rejection when given only noise
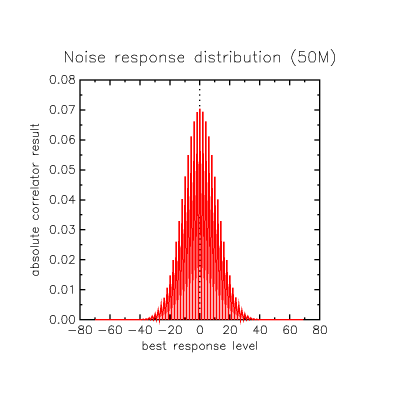
What about the reaction to having no signal at all... can it tell there is no transmission or does it falsely detect correlation? What is the highest false correlation result seen when challenged with noise? Here is the distribution of highest correlation results for 50 Million runs feeding it only white-ish binary noise with no correlation sequence component.
 The largest false response seen even once in the runs is +58, out of a full-scale match with a 0% bit-error rate of +128: one can put it that the probability of seeing a match better than +58 from noise is something greater than 1 in 50M. So we learn from this we can't trust any correlation result lower than, say, +64, to allow some margin. (This +64 requirement is shown with a blue line in the following graphs).
Random bit-error rate response
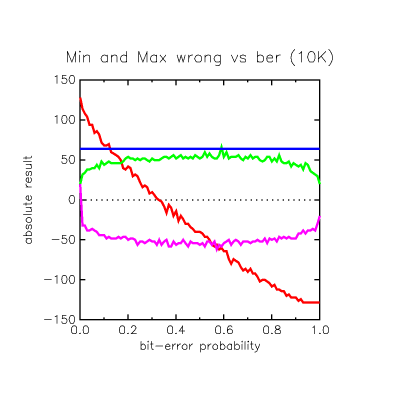
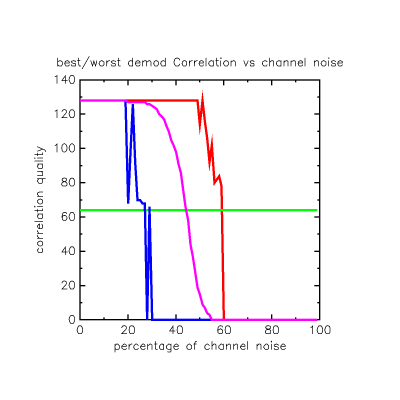
In this graph I ran the self-correlation 10,000 times per offset with different noise each time, and picks the worst (lowest) correct "position 0" sync match value (red) and plots it against the best (highest) wrong offset match value (green) in absolute match quality. The thin blue line shows the absolute correlation value of +64 we selected based on the first graph.
On the left where there is no noise, we can tell the correct sync by a wide margin. Where the red line crosses the green, at around 0.2 bit-error probability, it means the correct sync position can no longer be distinguished from a false match. But before then, the absolute correlation value for the correct offset has fallen below our +64 limit (selected because noise can create a +58 result) so detection is lost first at a 0.12 ber.
 Here is a plot of the ranking of the correct offset vs all of the other offsets. I expected the correct one to start at #1 and then slip down the rankings, but instead it starts at #1 and falls right to the bottom when it can't be selected as #1 any more.
 What it means is that up to around 0.12 - 0.15 ber (equates to 15 - 19 randomly selected flipped bits of the 128 in the pattern) you can detect the pattern VERY reliably. Any higher ber - with randomly selected bit errors - and your probability of detecting the pattern is very low.
Multibit dropout tolerance
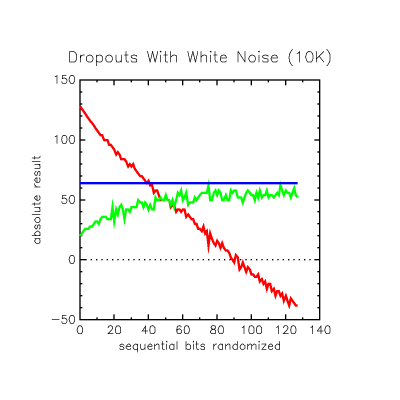
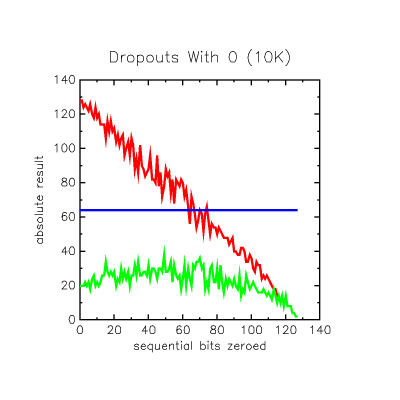
From my WiFi work I know that a common failure mode in RF packets is a multibit continuous dropout, that's different from the random bit errors introduced above. These graphs show the effect on worst correct offset margin from dropouts of all possible lengths randomly placed in the packet, where the dropout is filled with white noise, all zeroes or all ones.
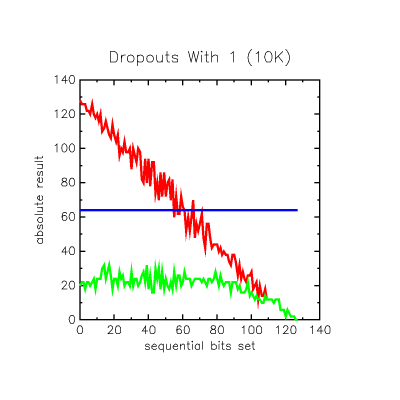
 Clearly it is beautifully insensitive to multibit contiguous dropouts. If the problem is that you have white noise crapping on the transmission, the loss of 39 contiguous bits can be sustained without dropping below the +64 result limit. If the problem is events that cause continuous static 1 or 0 to be read during the disturbance, the code is very insensitive to this and can still be detected with fully half of the bits sequentially zero'd out or up to 50 set to '1'. So the sync detection performance faced with contiguous dropouts actually exceeds that of random dropouts.
This last dropout graph shows performance when there are TWO dropped-out areas randomly (5,000 runs at each dropout length) placed in the packet at various dropout lengths (the dropout length is the same for both and they can overlap, explaining the noise at the end as they grow larger).
Clearly it is beautifully insensitive to multibit contiguous dropouts. If the problem is that you have white noise crapping on the transmission, the loss of 39 contiguous bits can be sustained without dropping below the +64 result limit. If the problem is events that cause continuous static 1 or 0 to be read during the disturbance, the code is very insensitive to this and can still be detected with fully half of the bits sequentially zero'd out or up to 50 set to '1'. So the sync detection performance faced with contiguous dropouts actually exceeds that of random dropouts.
This last dropout graph shows performance when there are TWO dropped-out areas randomly (5,000 runs at each dropout length) placed in the packet at various dropout lengths (the dropout length is the same for both and they can overlap, explaining the noise at the end as they grow larger).
 Again looking at the absolute result values for the graph (blue line) the optimal absolute result cutoff of +64 is seen at two blocks of 18 contiguous bits contaminated with noise. These are very severe insults that still allow a correct sync detection.
Conclusion
This means (to the accuracy of these simulations) if you draw a line at 15% bit-error rate, if you ever see any offset of the correlator giving an absolute result of +64 or better, there is a very high probability that:
- there is a genuine transmission in progress
- the offset reporting that result is the correct sync offset, and
- your bit-error rate is 15% or less
Conversely if no correlator offset gives +64 or better:- the bit-error rate is higher than 15%, or
- there is no transmission
This is a very robust correlator pattern! It can be improved further: at the moment the "score" for correlation adds 1 for a matched binary bit level and subtracts 1 for a binary mismatch. If the demodulator that is providing these bits gives a probability of a '1' or a '0' instead of a binary '1' or '0', then the result can be made from more information. A few "looks a bit like a 0" inputs will more weakly override many "definitely a 1" inputs, for example.
There is another great advantage to interleaving this pattern with the payload. If the sync pattern can be recovered considering the 15% bit-error rate that is allowed, it is possible to identify then which bits of the pattern were corrupted. Because the correlator code bits are interleaved with the payload, it suggests that if the payload is broken, that the problem is coming from the payload bits next to the known-bad correlator code bits. For example, if it is shown that say three contiguous bits of the correlator code channel are wrong, one has to wonder about the two payload bits that are inbetween them. If there are a small number of bits involved, it can be possible to "fuzz" the suspected bad payload bits to see if an otherwise unrecoverable ECC error can be solved.
One more advantage is that the robustness margin of 15% allows channel bit-error rate to be continually assessed during reception.